Damn the torpedoes, full speed ahead for gas production
Rig activity has skyrocketed in the U.S. and Canada, from less than 450 rigs to about 1,200 rigs, driven by the rebound in oil prices over about two years. This year, ICF’s Base Case projects continued growth—mostly in the oil-rich plays such as the Permian and Niobrara—with operating rigs rising to over 1,600 rigs by 2025. Additionally, activity in the Marcellus, Utica, and Haynesville shale plays will dominate gas-directed drilling during the next few years.
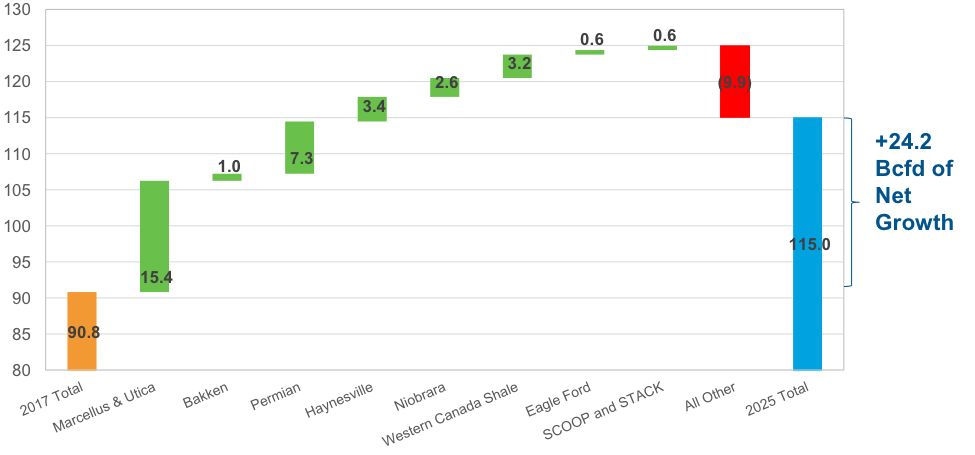
Change in North American Natural Gas Production (Billion Cubic Feet per Day, 2017-2025)

So, What Does This Mean?
With such robust supply growth, there will continue to be a downward preference for natural gas prices. Pending current geopolitical strife in the Middle East, the same would be true for oil prices given the high oil inventories around the globe. While the future seems bright for gas production, we must consider the range of negative drivers and infrastructure hurdles that could derail future revenue opportunities.
As energy markets become more complex, industry leaders are embracing an integrated approach to an increasingly globalized market. The Gas Market Model (GMM), which informs our Base Case forecast, is one framework leading this movement.
Operated on an integrated basis with ICF’s broader tool set (which includes the Integrated Planning Model for power sector modeling), the GMM provides an integrated assessment of supply, demand, and forward prices, including basis throughout North America.
What Could Possibly Go Wrong?
Significant delays in the development of oil and gas infrastructure and anemic market development especially in the Northeast region could both pose problems, and environmental issues most certainly pose a significant risk for the area’s development. Much of the projected incremental production from the area will require market growth; without such growth, the area’s incremental production would merely cannibalize production elsewhere, leading to significant gas-on-gas competition and much lower gas prices.
Market development remains imperative for continued supply development. Petrochemical activity both domestically and internationally as well as continued increases in power generation fueled by natural gas will underpin the market growth. Absent such growth, development of incremental oil and gas from lower cost plays will do nothing more than cannibalize development from less cost effective plays. Awareness of which plays have a cost advantage and will hold up the best in such an environment is important for capital preservation. Identifying the most robust assets (and which assets survive low market growth) is critical.
Drivers of Growth
- Increase in well activity, as well as continued advancement of horizontal well and fracturing technologies, and improvement in multi-well pad drilling applications.
- Rig performance has improved dramatically during the past few years and is expected to continue to do the same in the future. The use of higher horsepower rigs will continue to reduce the time to drill and complete wells, translating into reduced drilling costs.
- The use of pad drilling, which is the practice of drilling multiple wells from a single surface location, is becoming a standard in shale and tight oil plays. This practice has significantly reduced rig mobilization costs as more wells can now be drilled from a single location. The share of new wells that are pad drilled was only about 5 percent in 2006, growing rapidly to almost 60 percent by 2013, and now estimated at more than 80 percent. The share of wells drilled from multi-well pads is expected to continue to increase modestly in the future.
- Fracturing technologies will also continue to advance. A horizontal well typically will have multiple fracture “stages” applied along its lateral to increase the well’s contact with hydrocarbons contained in the producing formation. In some cases, there may be up to 30 to 40 different fracture stages applied within a single well.
Putting Production into Perspective
U.S. natural gas production saw record growth in 2017, with dry gas production climbing from roughly 71 billion cubic feet per day (bcfd) at the year’s onset to roughly 78 billion cubic feet per day by the end of the year, ultimately yielding an astounding 10 percent growth, compared to 3.5% decline from January to December 2016. According to ICF’s long-term forecasts, this record growth is projected to continue and is expected to net over 24 billion cubic feet per day (bcfd) from 2018 through 2025.
Gas production growth from the Marcellus and Utica is projected to account for over 60 percent of the growth (over 15 bcfd) while Permian production growth is projected to come in second with over 30 percent of the growth (at over 7 bcfd). Other plays to watch include the Haynesville, Niobrara, Bakken, and Western Canada shales. In total, U.S. and Canada dry gas production is projected to rise to roughly 115 bcfd by 2025.
We are prepared to leverage the GMM to assess the challenges and opportunities your company faces in this quickly evolving market. Learn more in our upcoming webinar, 3 Factors that Will Guide the Way Forward for Natural Gas, which will cover the summary of major issues in our 2nd Quarter Base Case. Follow The Spark or subscribe to the ICF Energy Digest for additional summaries of our Base Case forecast, as well as other key topics facing the industry today.