More states are embracing renewable energy development. And the opportunity is bigger than ever.
Renewable energy development is so much more than just solar.
The renewable energy landscape may be broader than we thought.
California and New York have historically received a lot of attention for renewable energy development, and for good reason. Home to a fifth of the U.S. population, they're the two largest markets for renewable portfolio standard (RPS)-driven renewable energy demand in the country. What’s more, they also have the most aggressive RPS requirements — 50 percent renewable energy by 2030.
There are other drivers of renewable energy in the region outside of the capacity needed to meet RPS policies, too. For example, New Mexico has its own production tax credit, which is currently set to expire at the end of 2017. The credit has created a large renewable queue and is driving both wind and solar capacity additions in the state. PURPA is another driver in some states, setting in motion capacity additions of 10 MW or less in Oregon and Idaho, albeit on a smaller scale. And finally, like the South, most of the states in the West are fully regulated. Renewable development can be driven by settlements or other actions that occur within the context of the long-term planning process.
What's Next for Solar and Wind Development in the U.S.?
The federal tax extensions for wind and solar have created a window of opportunity for renewable energy developers and investors—one that spans the majority of the country, extending far beyond California and New York. However, the U.S. landscape is varied and complex, and the market drivers that create opportunities can vary from region to region and state to state. As a result, it is important to consider the market specifics presented here when identifying and pursuing investment opportunities.
TABLE 4: Renewable Development Factors in The West
| State | RPS Policy? | Is the RPS Policy Oversupplied? | Previous Wind Devt.? | Previous Solar Devt.? | Is PURPA a Significant Driver? |
|---|---|---|---|---|---|
| AZ, CA | Yes | Near Term | Yes | Yes | No |
| CO, NM | Yes | No | Yes | Yes | No |
| ID, UT | No | - | Yes | Yes | Yes |
| NV | Yes | Yes | Yes | Yes | No |
| OR | Yes | Near Term | Yes | Yes | Yes |
| WA | Yes | Yes | Yes | No | No |
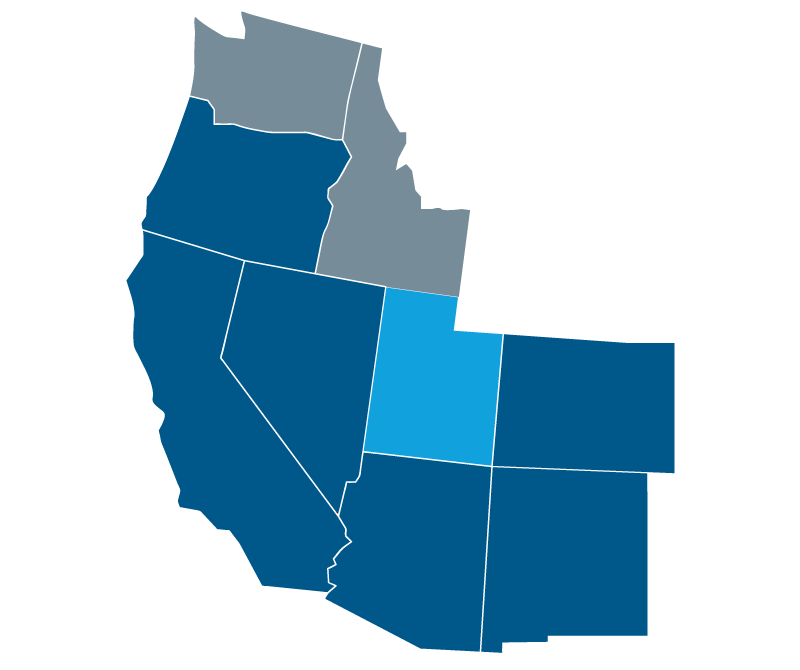
The majority of the states in this region also have their own RPS policy. These are largely oversupplied in the near term, or in some cases, fulfillment is being suppressed by the cost caps built into the RPS. However, the region’s non-California RPS policies can still serve as a primary or secondary driver for renewable development. For example, one of the region’s largest LSEs, PacifiCorp, recently issued an RFP for incremental renewable capacity. The move was partially driven by the federal tax extensions and partially by the need to meet RPS compliance obligations in California, Oregon, and Washington.
Of the four regions characterized here, renewable development in the West will be driven by the most diverse set of factors over the next several years. One of the primary factors will be out-of-state builds that will be used to meet California’s RPS, which, as previously mentioned, was increased to 50 percent by 2030.
California will need more than 18,000 GWh of additional renewable energy generation to meet its 2030 goals. This goes beyond the resources that are already contracted with the state’s Load Serving Entities (LSEs) or those that could be recontracted. The demand translates into a need for about 7,000–9,000 MW of incremental capacity, with some of that capacity being built outside California. Out-of-state resources that contribute to California’s RPS are already located in every state in this region except Colorado.
 The West
Diverse energy drivers
Solar development in this region will also be significant, despite generally poorer solar resources than the rest of the country, due to a number of solar-specific carve-outs in the region’s RPS policies. Delaware, Illinois, Maryland, New Jersey, Massachusetts, New Hampshire, Ohio, and Pennsylvania all have solar-specific carve-outs. Out of these states, Maryland, Vermont, and Massachusetts will see the most significant utility-scale solar development in the near future, although there is at least one project announced in every state in the region.
TABLE 3: Renewable Development Factors in The Northeast
| State | RPS Policy? | Is the RPS Policy Oversupplied? | Previous Wind Devt.? | Previous Solar Devt.? | Is PURPA a Significant Driver? |
|---|---|---|---|---|---|
| CT | Yes | No | Limited | Yes | No |
| DE, NJ | Yes | Near Term | Limited | Yes | No |
| IL | Yes | Yes | Yes | Yes | No |
| IN | No | - | Yes | Yes | No |
| MA, NY, RI, VT | Yes | No | Yes | Yes | No |
| MD, OH, PA | Yes | Near Term | Yes | Yes | No |
| ME, NH | Yes | No | Yes | No | No |
| WV | No | - | Yes | No | No |
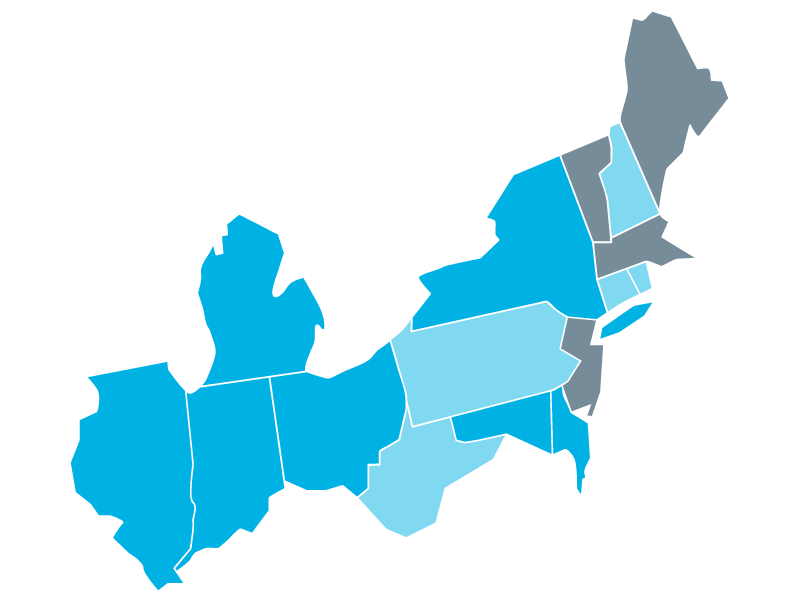
In PJM, which includes portions of Illinois and Indiana and all of Ohio, Pennsylvania, West Virginia, Maryland, Delaware, and New Jersey, the supply-demand balance is less tight than it is in New England. However, RPS-driven renewable energy demand is set to increase swiftly in the coming years. That increase could rationalize a lot of the current oversupply, although the build rate for new renewables will determine how quickly that occurs. Regardless, opportunities for wind development remain, especially in Illinois, Indiana, and Ohio.
Although the federal tax extensions will still lower costs, the region's RPS policies will drive (or at least support) renewable development in the Northeast. This is especially true in New England (ISO-NE). Due to a tight balance between RPS-driven renewable energy demand and supply, the area is home to the highest renewable energy credit prices in the country. While recent market developments—including lower than expected energy demand and increased renewable build rates—have dampened this somewhat, New England’s RPS goals will continue to increase in future years. In addition, the New England Clean Energy RFP, held jointly by Connecticut, Massachusetts, and Rhode Island, will assure that new renewable capacity comes online over the next several years.
The North
RPS policies dominate
There are also several opportunities for solar in this region. Solar development is starting to pick up in select states, including Michigan, Wisconsin, Minnesota, Missouri, and Texas. While projects in Wisconsin and Missouri have been small so far (less than 10 MW), larger projects have been announced or are under construction in Michigan, Minnesota, and Texas. As the PTC phases out, driving competition between solar and wind, the opportunities for solar development in the Midlands will expand. Texas, in particular, houses excellent solar resources in the Western part of the state.
TABLE 2: Renewable Development Factors in The Midlands
| State | RPS Policy? | Is the RPS Policy Oversupplied? | Previous Wind Devt.? | Previous Solar Devt.? | Is PURPA a Significant Driver? |
|---|---|---|---|---|---|
| IA, MI, MN, WI | Yes | Yes | Yes | Limited | Yes |
| MO, TX | Yes | Yes | Yes | Yes | No |
| MT | Yes | Yes | Yes | No | No |
| NE, OK | No | - | Yes | Limited | No |
| KS, ND, SD, WY | No | - | Yes | No | No |
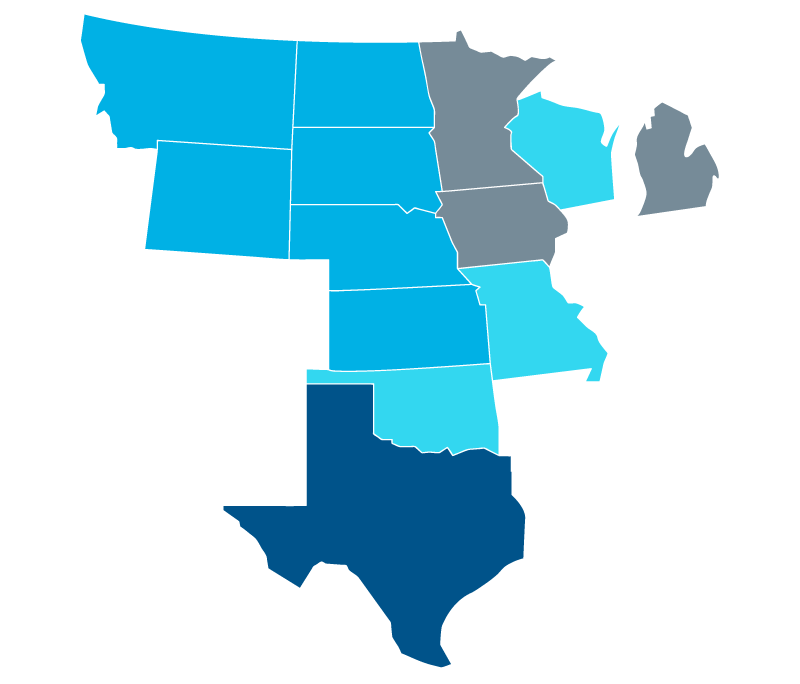
Like the South, improving renewable cost and performance and federal tax credit extensions will drive most future renewable development in this region. Unlike the South, however, wind will dominate renewable development in the Midlands — especially through 2020 when the latest PTC extension is set to expire.
Most wind projects in this region are large, with capacities of 100 MW or more. This may necessarily limit investment opportunities for smaller market players. Also, established utilities and renewable development firms (that intend to own their projects) develop many of the projects in this region. Even so, the large number of projects means a large number of investment opportunities.
States in the Midlands region are no stranger to renewable energy development. The area is home to the best wind resources in the country and more than a handful of mandatory RPS policies. But some hurdles exist. In some states (Michigan, Wisconsin, Iowa, Texas, Montana), RPS policies are no longer increasing in percentage or capacity terms. In others, like Missouri and Minnesota, are mostly oversubscribed.
The Midlands
Big wind opportunity
North Carolina remains the outlier in this region for a few reasons. A 35 percent state income tax credit — eliminated for most projects at the end of 2015 — allowed for recent solar capacity additions. Even without the tax credit, the state's solar market should be one of the most active in the country due to PURPA and voluntary capacity additions. North Carolina requires utilities to sign power purchase agreements of up to 15 years with qualifying facilities (5 MW or less) at the utility’s avoided cost.
TABLE 1: Renewable Development Factors in The Southeast
| State | RPS Policy? | Is the RPS Policy Oversupplied? | Previous Wind Devt.? | Previous Solar Devt.? | Is PURPA a Significant Driver? |
|---|---|---|---|---|---|
| AL, FL, GA, TN | No | - | No | Yes | No |
| AR, LA | No | - | No | No | No |
| KY, MS, VA | No | - | No | Limited | No |
| NC | Yes | Yes | Limited | Yes | Yes |
| SC | No | - | No | Limited | Yes |
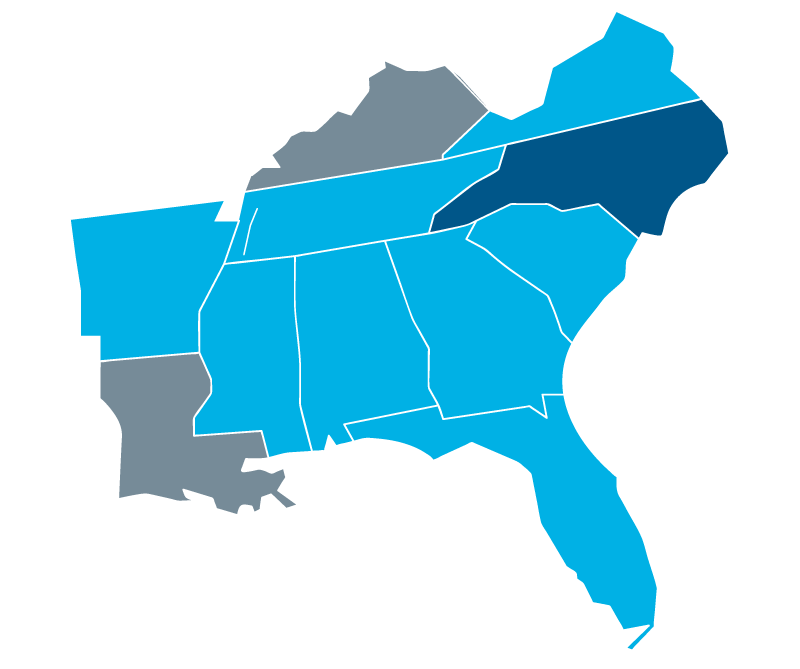
Beyond a few proposed wind projects in North Carolina and Tennessee, solar PV will dominate renewable development in the South. The ITC extension could drive solar development in the South through at least the mid-2020s. To date, at least one utility-scale solar project is operating or has been approved in each state in this region. That said, opportunities in Kentucky and Louisiana remain limited.
The states in this region are all regulated electricity markets, so state regulators must approve projects. It also means that the integrated resource planning process may dictate solar capacity additions. and may be conducted through a request for proposal (RFP). For example, Georgia Power recently reached a settlement under its long-term energy plan with its public service commission. The utility agreed to add two blocks of 525 MW of renewable capacity, most of which would be added through competitive bidding (through RFPs) in 2017 and 2019. Barring further negotiations, this settlement defines the opportunity for renewable development in Georgia through 2021.
Renewable development in the South has lagged behind the majority of the country. The region is home to just one mandatory RPS policy and generally poor wind resources. The region is now seeing more substantial renewable development, however, thanks to improving costs and performance for renewable technologies and federal income tax credits, more substantial renewable development in this region is beginning to occur.
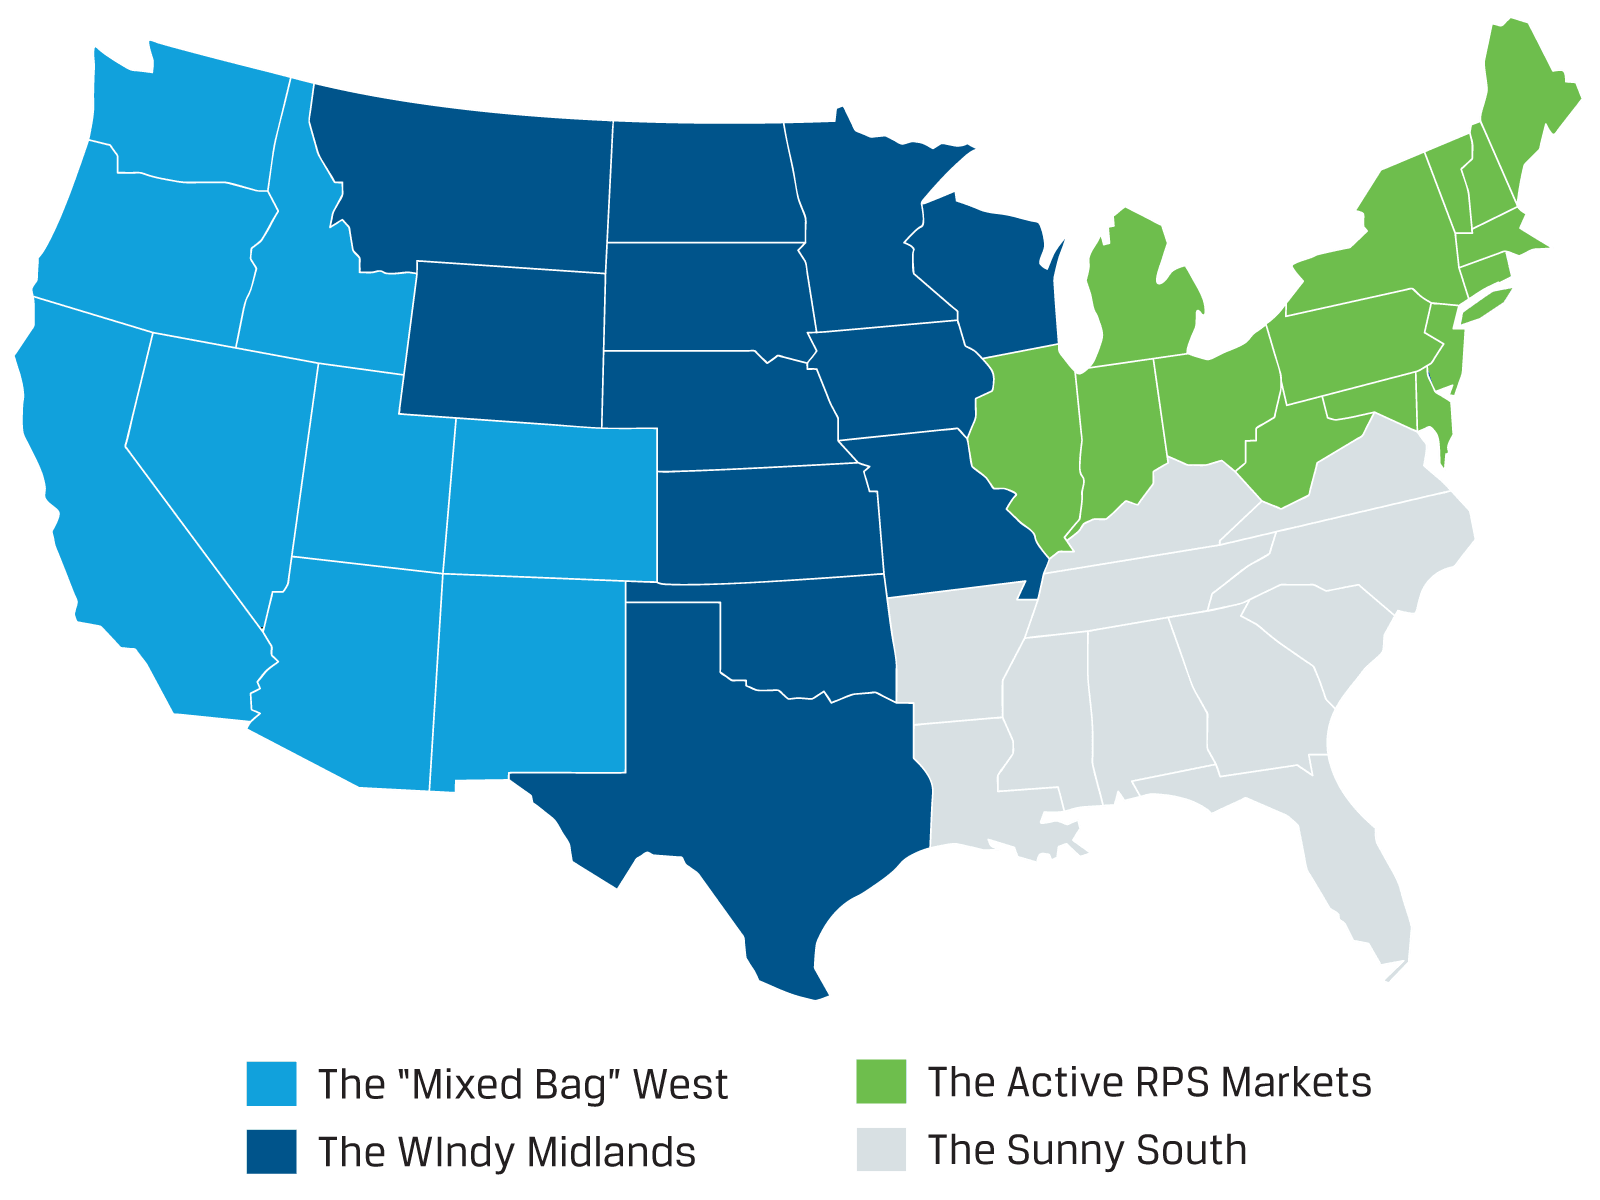
In the heat map below — and throughout the article — darker states provide greater near-term opportunities for renewables than lighter states.
The South
Where solar is king
EXHIBIT 2: Renewable Energy Regions
A renewable portfolio standard (RPS) is a regulatory mandate to increase production of energy from renewable sources such as wind, solar, biomass and other alternatives to fossil and nuclear electric generation. It's also known as a renewable electricity standard.1
Aided by the long-term extension of the federal tax incentives for wind and solar passed by Congress at the end of 2015, this trend is set to continue in the coming years. Current major drivers of wind and solar development include:
Improving Cost and Performance:
According to the Department of Energy, costs for land-based wind have decreased by 41 percent since 2008. Utility-scale solar has decreased by 64 percent in the same period.2
Federal Tax Incentives:
Three federal tax incentives have been extended:3
- The Consolidated Appropriations Act, 2016, passed by Congress in December 2015. Federal tax incentives for wind and solar.
- The Production Tax Credit (PTC). Typically associated with wind, was extended for projects that begin construction through 2019.
- The Investment Tax Credit (ITC). Typically associated with solar, was extended for projects that begin construction through 2021.
The election of Donald Trump does introduce some uncertainty about the future of the federal tax incentives. It's unlikely that tax incentives will be cut before the current phase-out schedule, but not impossible.
Renewable Portfolio Standards and RPS Carve-Outs:
29 states and the District of Columbia currently have mandatory RPS policies. Also, several states have carve-outs that set aside part of their requirement for specific technologies, like distributed generation, solar, or offshore wind. But some of the nation’s RPS requirements are oversupplied compared to long-term targets. This means that the existence of an RPS policy doesn't always make it a driver of renewable energy growth.
The Public Utilities Regulatory Policy Act (PURPA):
PURPA was created in 1978 to promote ownership of generating assets by non-utility power producers in regulated power markets. Under PURPA, utilities must buy power from independent producers at their calculated avoided cost. As the costs of solar power have come down, PURPA has started to drive solar installations in select states.
Although there are several drivers for U.S. wind and solar development, the relevant ones can vary from region to region. In turn, these drivers affect the development and investment opportunities for wind and solar in the coming years.
The below map characterizes four regions of the United States based on relevant drivers. It also maps each region’s propensity to develop either wind or solar.
 Overview
What's Driving Wind and Solar Development in the U.S.?
Recent utility-scale wind and solar photovoltaic (PV) installations, though, reveal a much more extensive renewable landscape across the country. Since 2013, 26 states have added at least one utility-scale wind project. PV installations over this period have been even more prevalent, covering 33 states.
EXHIBIT 1: Wind and Solar PV Capacity Installations By Region, 2013 Through The H1 2016 (MW)
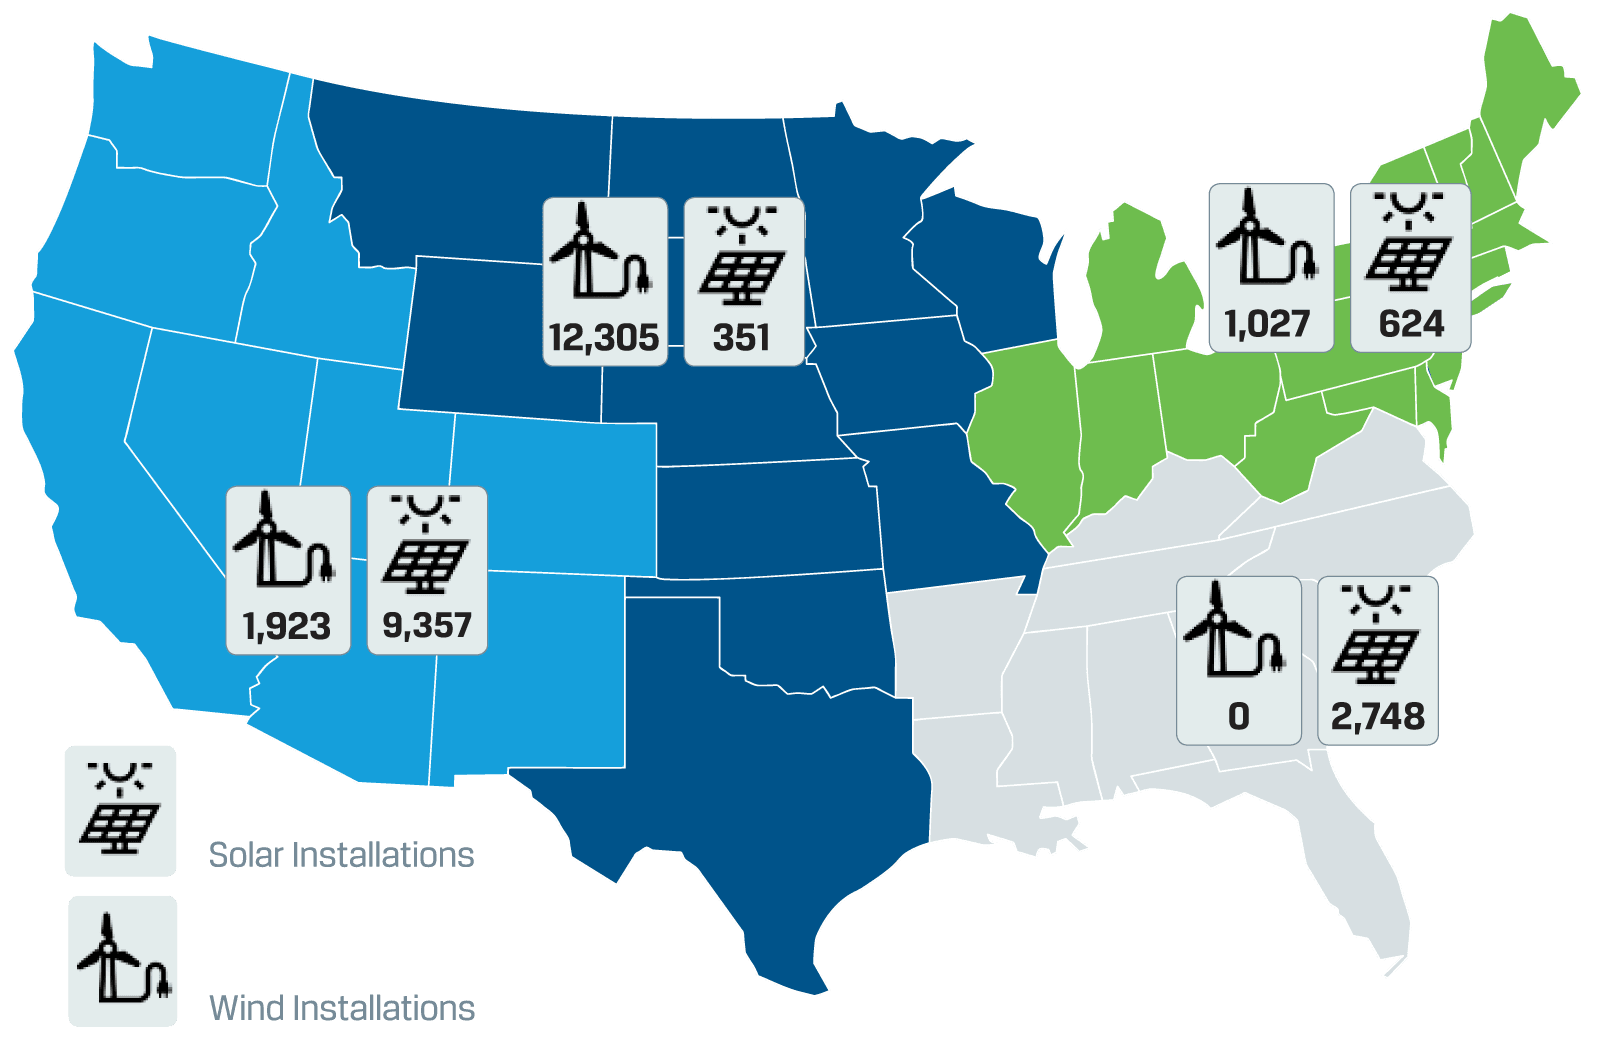
Sources: 1. Wind installation data were obtained from the American Wind Energy Association’s quarterly “Wind Industry Market Reports.” 2. Solar installation data were obtained from Greentech Media’s “Q3 2016 Solar Market Insight Report.”
- 1http://www.nrel.gov/tech_deployment/state_local_governments/basics_portfolio_standards.html
- 2As measured by levelized cost of energy (LCOE). Source: https://www.energy.gov/eere/downloads/revolutionnow-2016-update
- 3Eligible projects trigger their construction date by meeting one of two tests. The first is to begin “physical work of a significant nature.” The second test is the 5% safe harbor test, for which a developer must spend at least 5 percent of the expected total project costs, usually by placing an order for a significant piece of equipment.