How airports can save costs via better on-time performance
Delays cost airlines time, money, and passenger loyalty. How can airports get in front of them?
Today, most large airports in the world suffer from congestion and the resulting poor on-time performance (OTP). Last year, among the larger United States airports, only Salt Lake City and Minneapolis had more than 85% of their flights depart on time, and the arrival statistics were similar. Those same two airports were also the only ones that passed the 85% limit for flights arriving on time.
More airports should be paying attention to the example set by their Midwestern counterparts. Delays cost airlines time, money, and passenger loyalty. Poor OTP disrupts passenger travel and puts an additional cost burden on the airlines themselves, ultimately making air travel more expensive than necessary. At London’s Heathrow Airport alone, airlines keep a buffer capacity of around nine aircraft in their schedules just to mitigate the effects of congestion and the resulting OTP issues.
One thing airline management teams can do to mitigate poor OTP is to improve aircraft turnaround times (ATO). And in a time when airline costs are going up (e.g., fuel, crews, interest rates, etc.), making the ground operations leaner and achieving better ATO and OTP is critical. Improving ATO is not an easy fix, but over time it can make a huge impact.
The Harmful Habit of Schedule Padding
Airlines facing deteriorating OTP have two basic options:
- Building buffers. Airlines can build more buffer time into the schedules and build up reserve capacity in the form of aircraft, crew, ground staff, etc.
- Addressing root causes. Airlines can also try to address the root causes of poor OTP, which usually means changing processes.
Obviously, building the buffers is a quicker, but more expensive, solution in the long term. In fact, airlines tend to do it naturally each time they revise their schedules and set their scheduled block times based on the statistics of the preceding periods. To demonstrate how this happens, consider two examples of how scheduled block times developed on two routes in the United Kingdom:
- Aberdeen International Airport – London Heathrow: On this route, congestion developed on the London end, prompting airlines to build buffer time into their schedules.
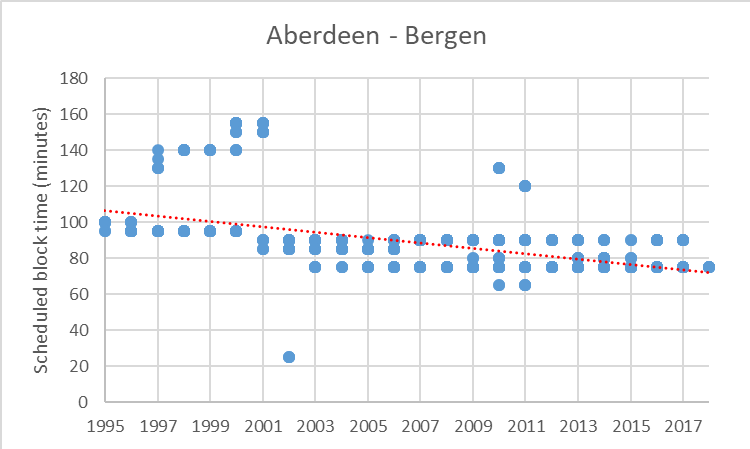
- Aberdeen International Airport – Bergen Airport: This route does not suffer from congestion on either end, there was no need to pad the schedules.
Source: OAG
Exhibit 1 | Scheduled Block Times on Two Routes Out of Aberdeen
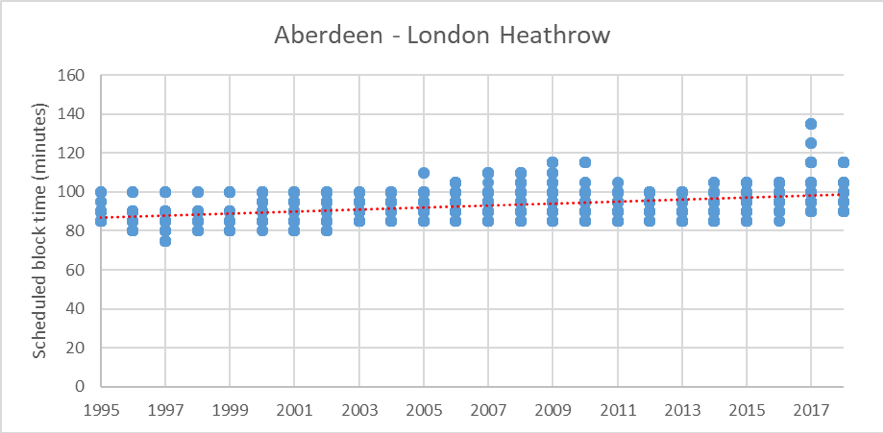
As the top chart suggests, the flights to London Heathrow kept becoming longer over time. In 1995, the average block time here was 88 minutes; in 2017, that figure jumped to 100 minutes.
In other words, block times increased by 14%.
The block times on the Aberdeen-Bergen route, on the other hand, decreased from an average of 99 minutes in 1995 to 79 minutes in 2017. In other words, the block times improved 20% thanks to faster, more modern aircraft (like the Q400) and to the absence of congestion.
ICF estimates that there are more than nine aircraft years' worth of buffer time in the schedules of the flights touching London Heathrow
Let’s do the math. From the above we can conclude that the average flight touching Heathrow today includes somewhat more than 10 minutes of block time buffer that wasn’t there 25 years ago. There were 475,000 aircraft movements at Heathrow in 2017. If all of them had the aforementioned 10-minute buffer time, that would be equal to nine aircraft years-worth of buffer capacity in the airlines’ schedules for that single airport.
Do Buffers Help OTP?
Obviously, OTP is influenced by many factors, not just scheduled flight time, but one would expect that building buffers into the schedule helps to achieve better OTP. However, this is not always the case (Exhibit 2).
The following table compares the average scheduled block times and the OTPs of three airlines whose flights were arriving to Boston Logan International Airport (BOS) in August 2017.
Exhibit 2 | Scheduled Block Times and OTPs of Flights Arriving to BOS (August, 2017)
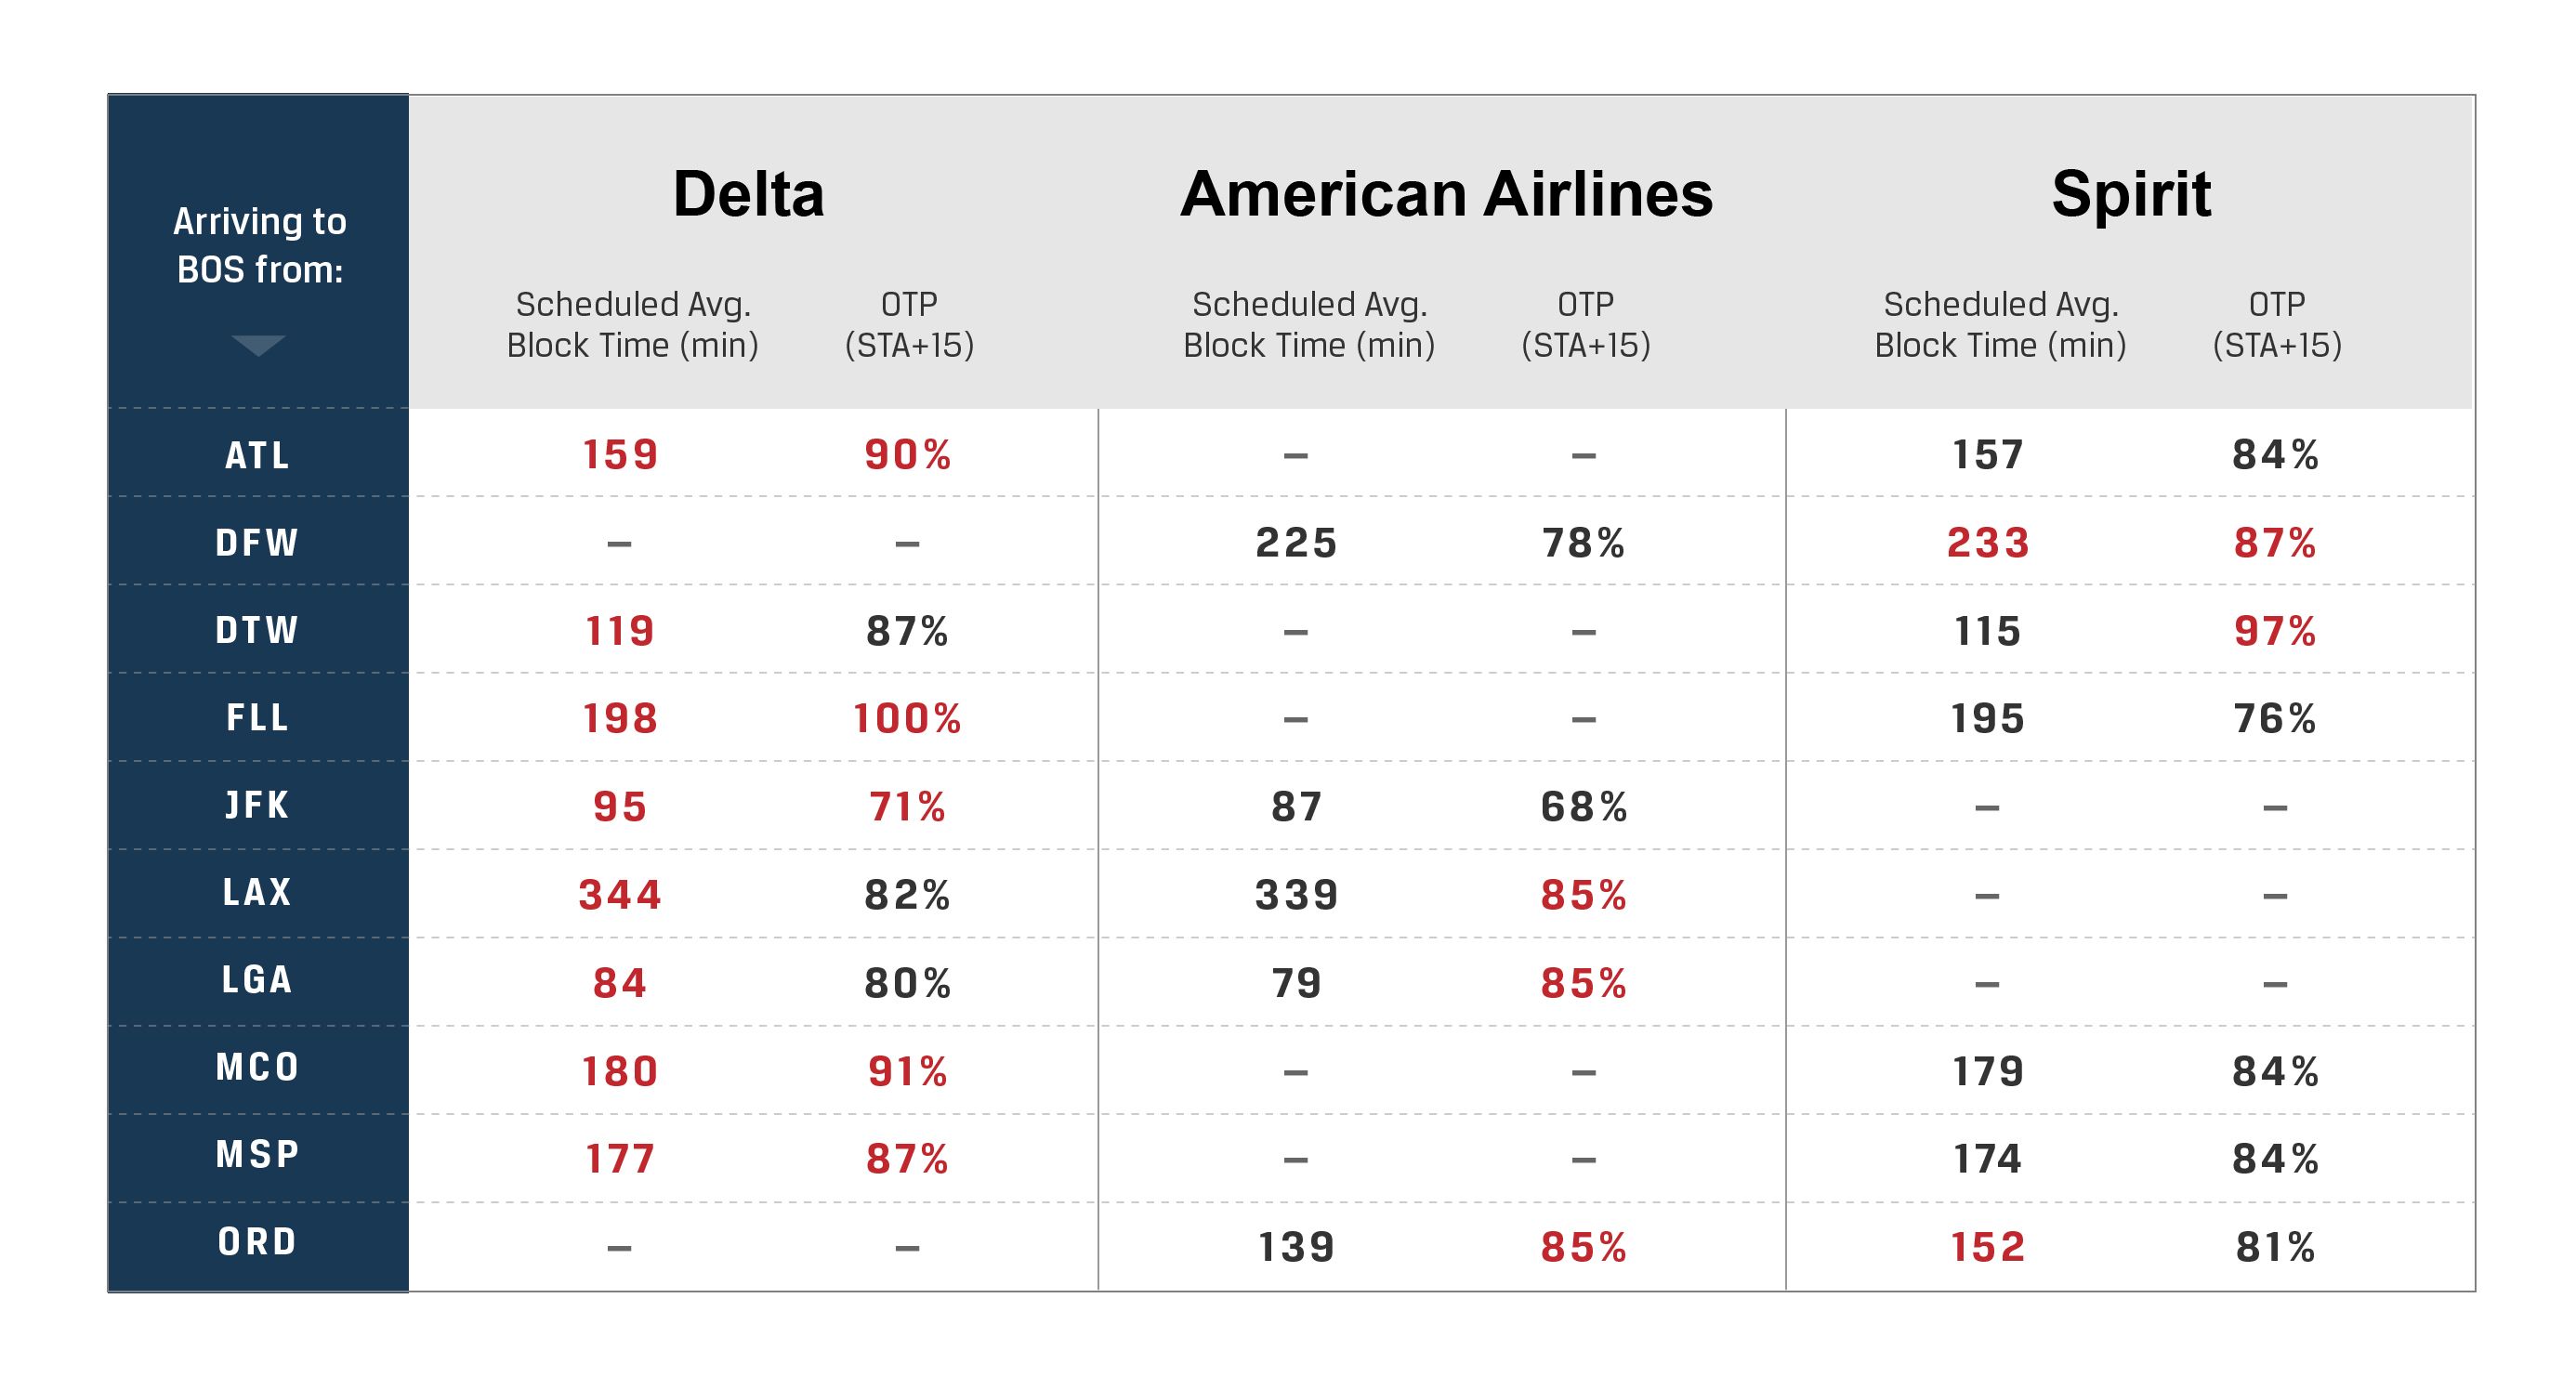
Source: U.S. Department of Transportation (DOT) on-time statistics
The red fonts indicate the longest scheduled block times and the best OTP for the given route. One would expect that the longer block times will trigger better OTP. However, this was not the case in four out of 10 example routes shown in the table. For example, on the O’Hare International Airport (ORD) route, Spirit had a 152-minute average scheduled block time, but its OTP was inferior to that of American Airlines, which clocked in at a 139-minute average.
The next table shows the results of a similar analysis for flights arriving to ORD.
Exhibit 3 | Scheduled Block Times and OTPs of Flights Arriving to ORD (August, 2017)
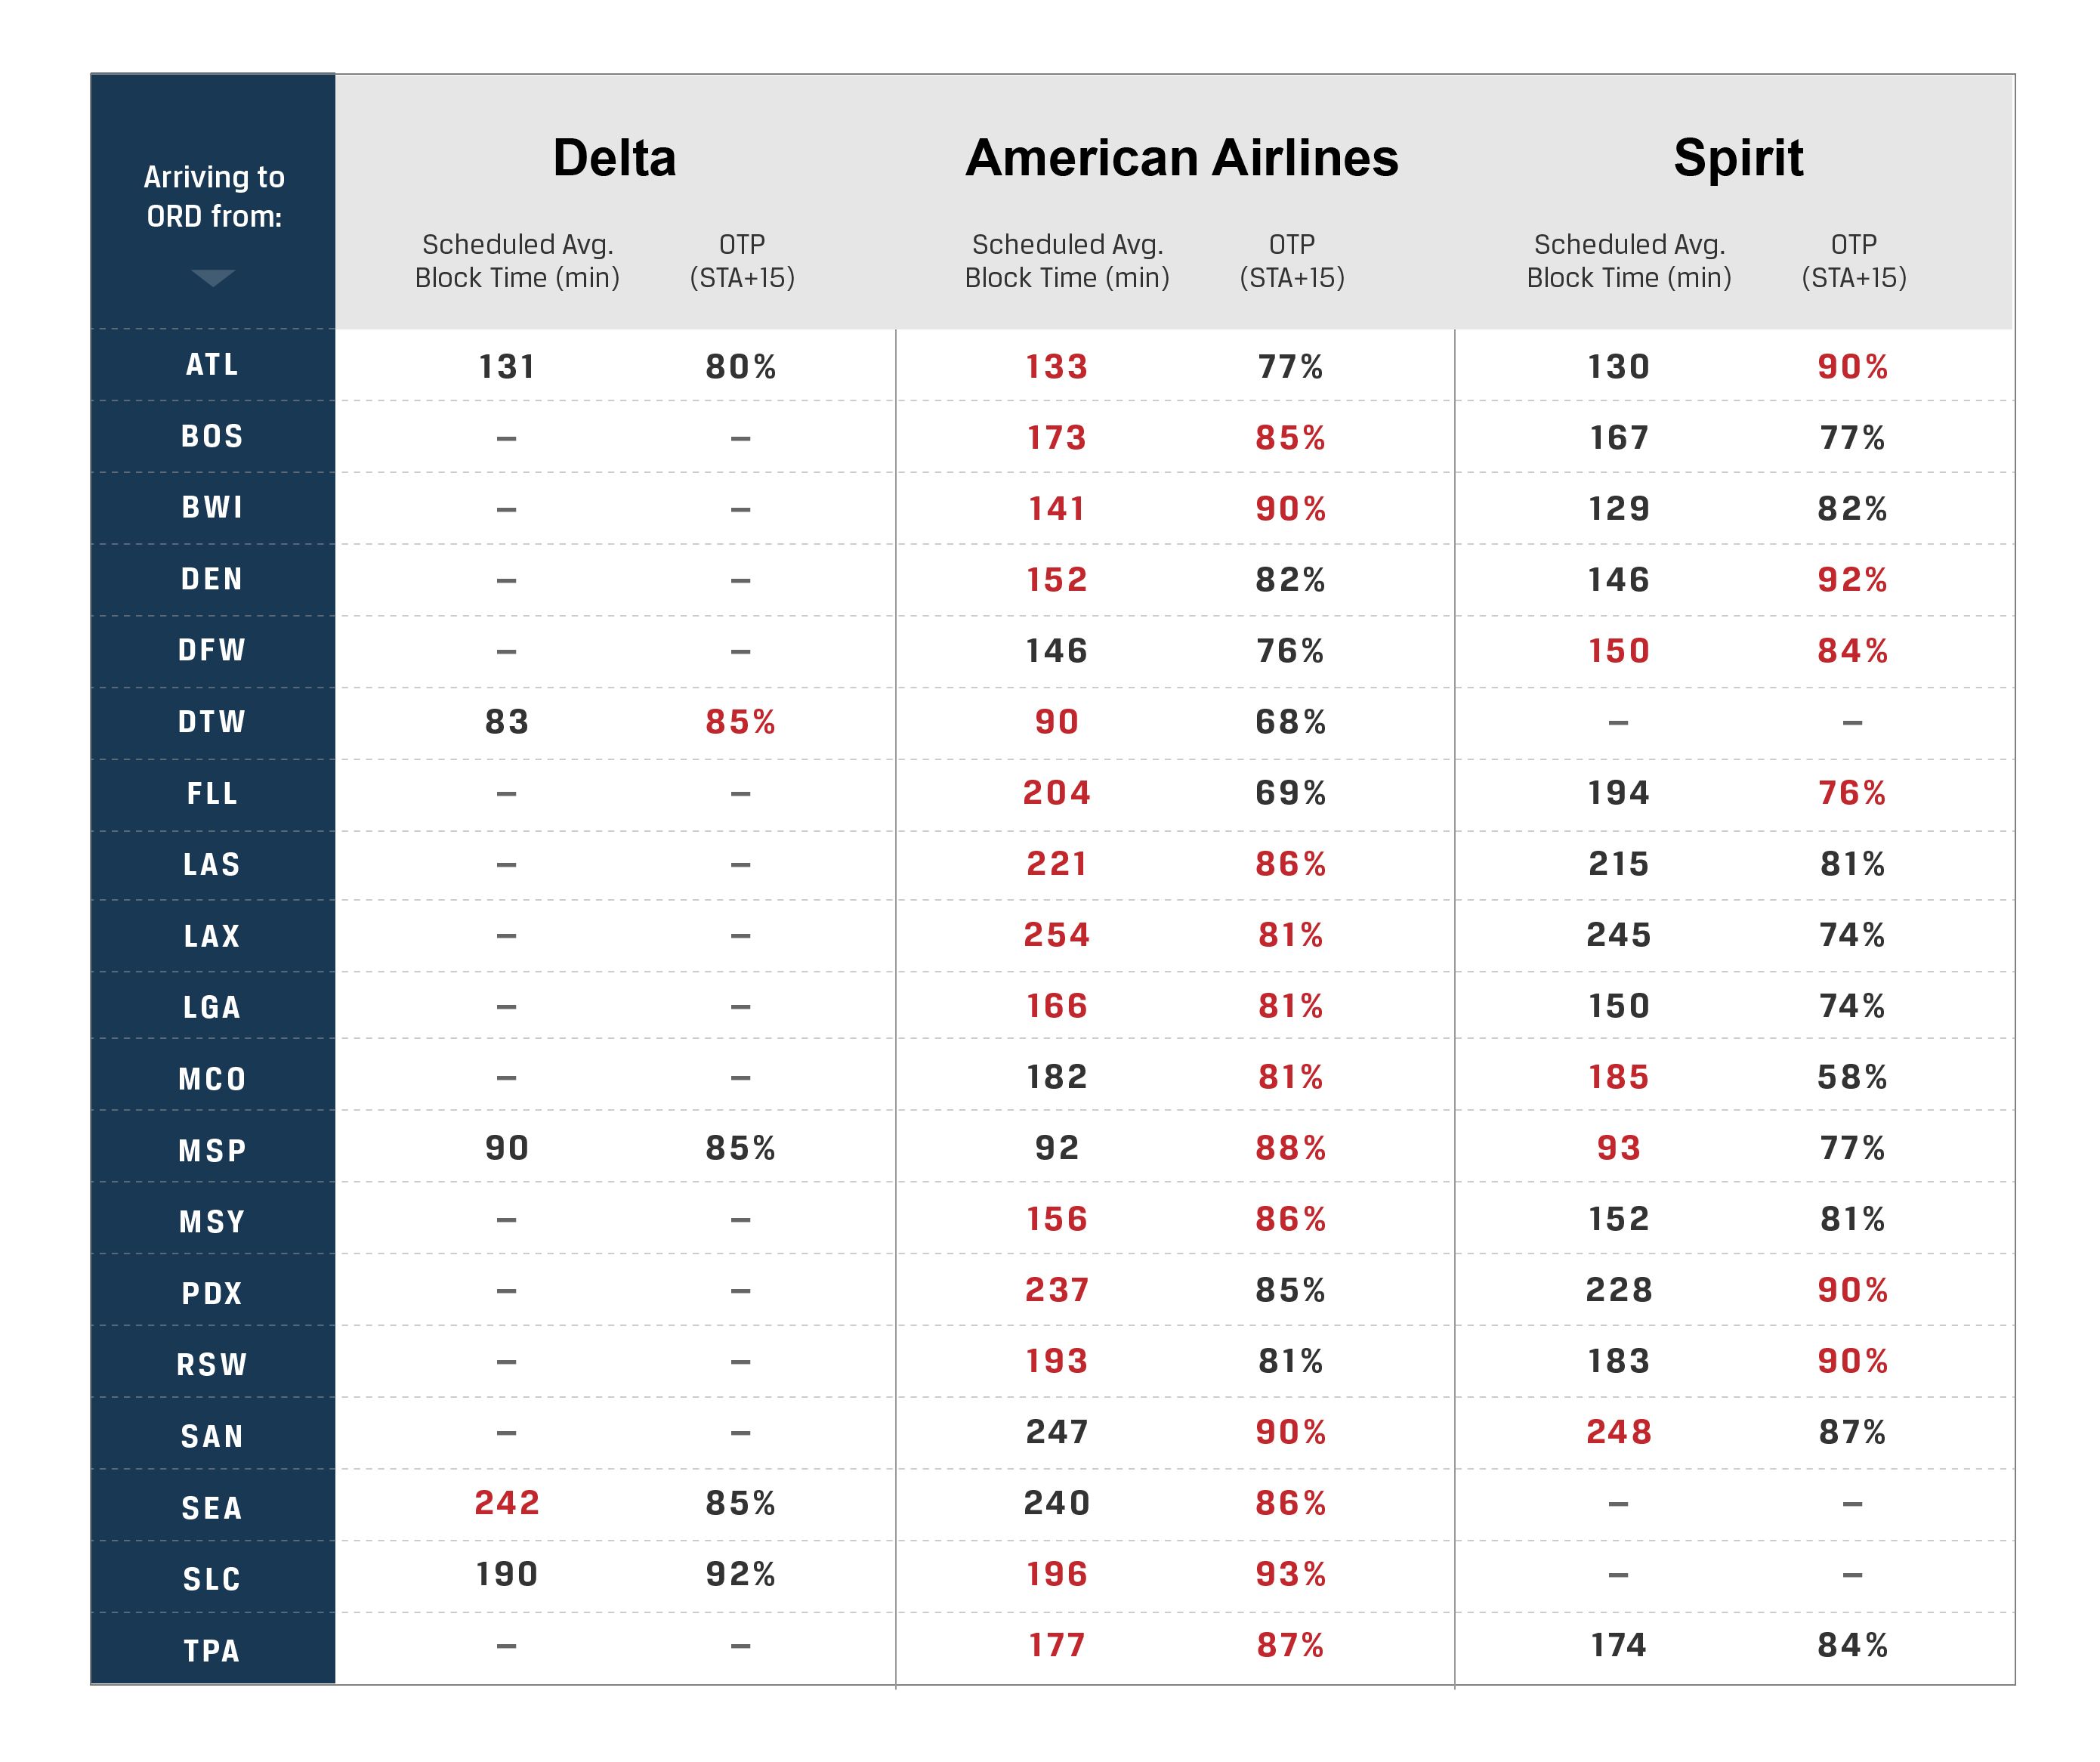
Source: U.S. Department of Transportation (DOT) on-time statistics
The conclusions are similar for this set of flights: the airline with the longer block times did not have better OTP in 10 out of 19 routes.
Once again, poor OTP can be caused by multiple factors. Airlines work with long lists of delay codes, and determining which ones to attribute to any given moment of a delay is not a straightforward exercise. None of this, though, changes the basic purpose of buffers in the schedule. We can conclude that building buffer time into the schedule generally helps OTP, but is not always sufficient, and—as shown before—the buffers come at a substantial cost to the airlines.
Shorter Turn Times = Long-Term Impact
Beyond the associated costs, the other problem with buffer time in the schedule is that it hides all problems equally, like a blanket. The inefficiencies in the airline’s own operations become hidden even though the airline could address these (as opposed to, say, weather delays).
In my team’s experience, if an airline suffers from poor OTP, it usually suffers from long aircraft turnarounds (ATO) as well. Ultimately, ATO is an indicator of the efficiency of an airline’s ground operations processes, and good ATO can help recover the OTP.
Bad turnaround performance is typically caused by a multitude of small factors, such as:
- unstructured boarding processes;
- cabin cleaning processes that are not aligned with the aircraft type;
- poorly planned flight crew aircraft swaps;
- communication inefficiencies between various ground handling teams (e.g., fueling and push back);
- paper-based ground handling processes; and
- cabin baggage allowance policies that are not aligned with turn-time targets or not consistently followed.
Addressing bad turnaround performance is a complex and time-consuming undertaking. However, good ATO has many positive effects. It can help achieve good OTP; reduce built-in buffers for schedules, spare equipment, and spare people; and improve ground operation.
All of the above translate into savings. In a time when airline costs are going up (e.g., fuel, crews, interest rates, etc.), making the ground operations leaner and achieving better ATO and OTP is one important lever for management.